PrimeCodex
PrimeCodex
PrimeCodex
An updated dashboard with new features and design to help manage user trading accounts.
An updated dashboard with new features and design to help manage user trading accounts.
An updated dashboard with new features and design to help manage user trading accounts.
Role:
Role:
Product Designer
Product Designer
Project:
Project:
PrimeCodex
PrimeCodex
Year:
Year:
Q4 2021
Q4 2021
Project Overview
Project Overview
Project Overview
PrimeCodex goals in 2022 were to reach more potential customers and give the best service for the current users. To reach these goals, they decided to redesign the current dashboard look because the current dashboard doesn't represent their brand, implement current dashboard features in the new dashboard, and lastly add new features.
PrimeCodex goals in 2022 were to reach more potential customers and give the best service for the current users. To reach these goals, they decided to redesign the current dashboard look because the current dashboard doesn't represent their brand, implement current dashboard features in the new dashboard, and lastly add new features.
PrimeCodex goals in 2022 were to reach more potential customers and give the best service for the current users. To reach these goals, they decided to redesign the current dashboard look because the current dashboard doesn't represent their brand, implement current dashboard features in the new dashboard, and lastly add new features.
Problems
Problems
Problems
The current dashboard interface doesn't match and represent the PrimeCodex brand because it was built using a template.
The current dashboard interface doesn't match and represent the PrimeCodex brand because it was built using a template.
Most of the users are already familiar with existing features in the current dashboard. The new dashboard should also come with the existing features and doesn't change the experience.
Most of the users are already familiar with existing features in the current dashboard. The new dashboard should also come with the existing features and doesn't change the experience.
New features should be added, but the time and resources are limited.
New features should be added, but the time and resources are limited.
Proposed Solutions
Proposed Solutions
Proposed Solutions
I spent the first week of this project doing research. First, I need to be familiar with the current dashboard and learn the flow of the existing features. Second, I need to find which new features should be prioritized and available in the new dashboard. I created surveys and got answers from 50 existing users (active traders) who use PrimeCodex's existing dashboard and had one-on-one interviews with 5 of them. This will help me to better understand the user journey and find which new features they need the most.
I spent the first week of this project doing research. First, I need to be familiar with the current dashboard and learn the flow of the existing features. Second, I need to find which new features should be prioritized and available in the new dashboard. I created surveys and got answers from 50 existing users (active traders) who use PrimeCodex's existing dashboard and had one-on-one interviews with 5 of them. This will help me to better understand the user journey and find which new features they need the most.
I spent the first week of this project doing research. First, I need to be familiar with the current dashboard and learn the flow of the existing features. Second, I need to find which new features should be prioritized and available in the new dashboard. I created surveys and got answers from 50 existing users (active traders) who use PrimeCodex's existing dashboard and had one-on-one interviews with 5 of them. This will help me to better understand the user journey and find which new features they need the most.
Results
Results
Results
84% of the survey participants are already familiar with current dashboard features and have no issues when using them. 16% of them sometimes have trouble or need more time to complete certain actions in the current dashboard features.
84% of the survey participants are already familiar with current dashboard features and have no issues when using them. 16% of them sometimes have trouble or need more time to complete certain actions in the current dashboard features.
84% of the survey participants are already familiar with current dashboard features and have no issues when using them. 16% of them sometimes have trouble or need more time to complete certain actions in the current dashboard features.
75% of the survey participants need 3 features to be implemented, 20% of them need 5 new features, and the rest say that they don't really need any new features.
75% of the survey participants need 3 features to be implemented, 20% of them need 5 new features, and the rest say that they don't really need any new features.
75% of the survey participants need 3 features to be implemented, 20% of them need 5 new features, and the rest say that they don't really need any new features.
The most requested features are internal transfer, user partnership, payment gateway, and account manager.
The most requested features are internal transfer, user partnership, payment gateway, and account manager.
The most requested features are internal transfer, user partnership, payment gateway, and account manager.
Solutions Based on Research
Solutions Based on Research
Solutions Based on Research
The new dashboard should be implemented and represent PrimeCodex brand colors.
The new dashboard should be implemented and represent PrimeCodex brand colors.
The new dashboard should be implemented and represent PrimeCodex brand colors.
Get familiar with the dashboard's existing features by using them and behave as a user and see if there is room for improvement for these features when implemented in the new dashboard.
Get familiar with the dashboard's existing features by using them and behave as a user and see if there is room for improvement for these features when implemented in the new dashboard.
Get familiar with the dashboard's existing features by using them and behave as a user and see if there is room for improvement for these features when implemented in the new dashboard.
Prioritizing the new features based on user needs and hearing their feedback.
Prioritizing the new features based on user needs and hearing their feedback.
Prioritizing the new features based on user needs and hearing their feedback.
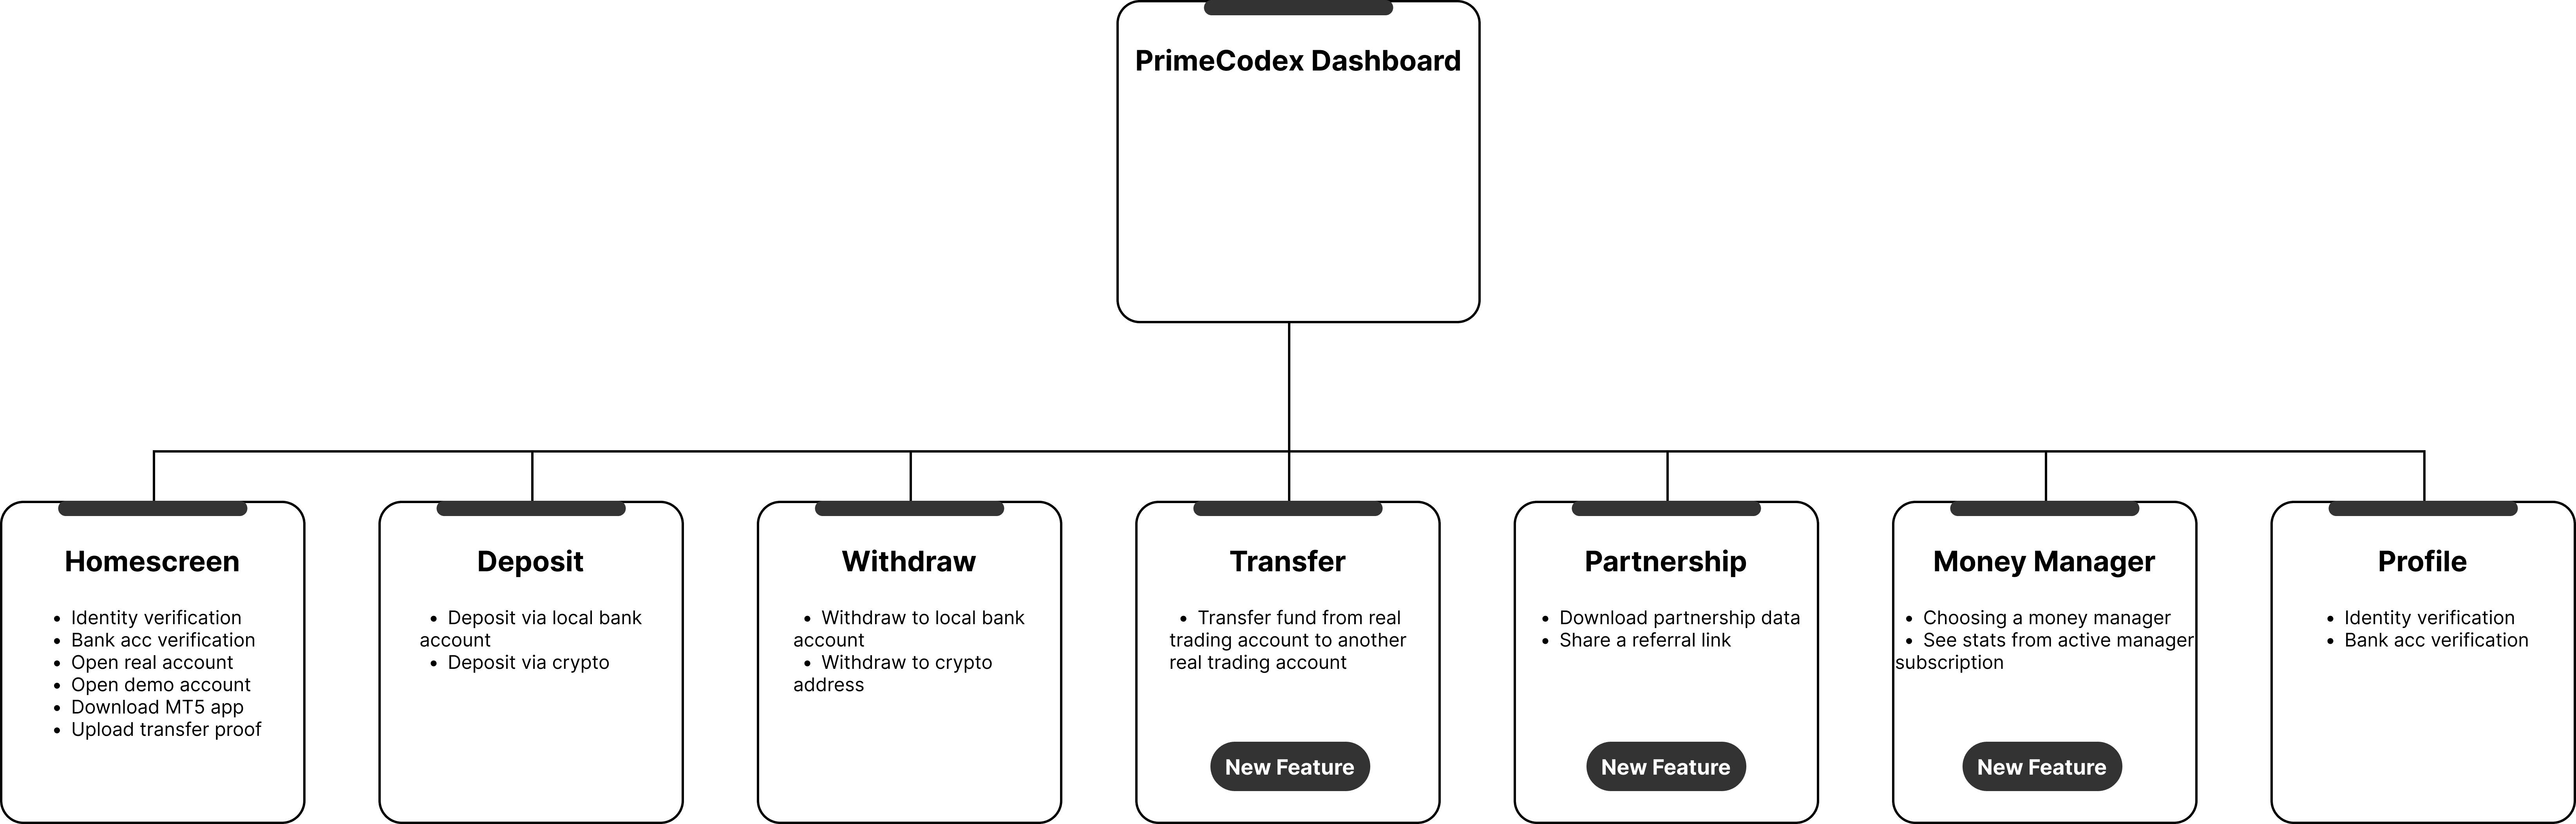
First Approach
First Approach
First Approach
The first approach that we took was to structure what should be in the new dashboard. From the below sitemap, we got the foundation for the new dashboard and also as a guideline for the improvement of the existing features.
The first approach that we took was to structure what should be in the new dashboard. From the below sitemap, we got the foundation for the new dashboard and also as a guideline for the improvement of the existing features.
The first approach that we took was to structure what should be in the new dashboard. From the below sitemap, we got the foundation for the new dashboard and also as a guideline for the improvement of the existing features.
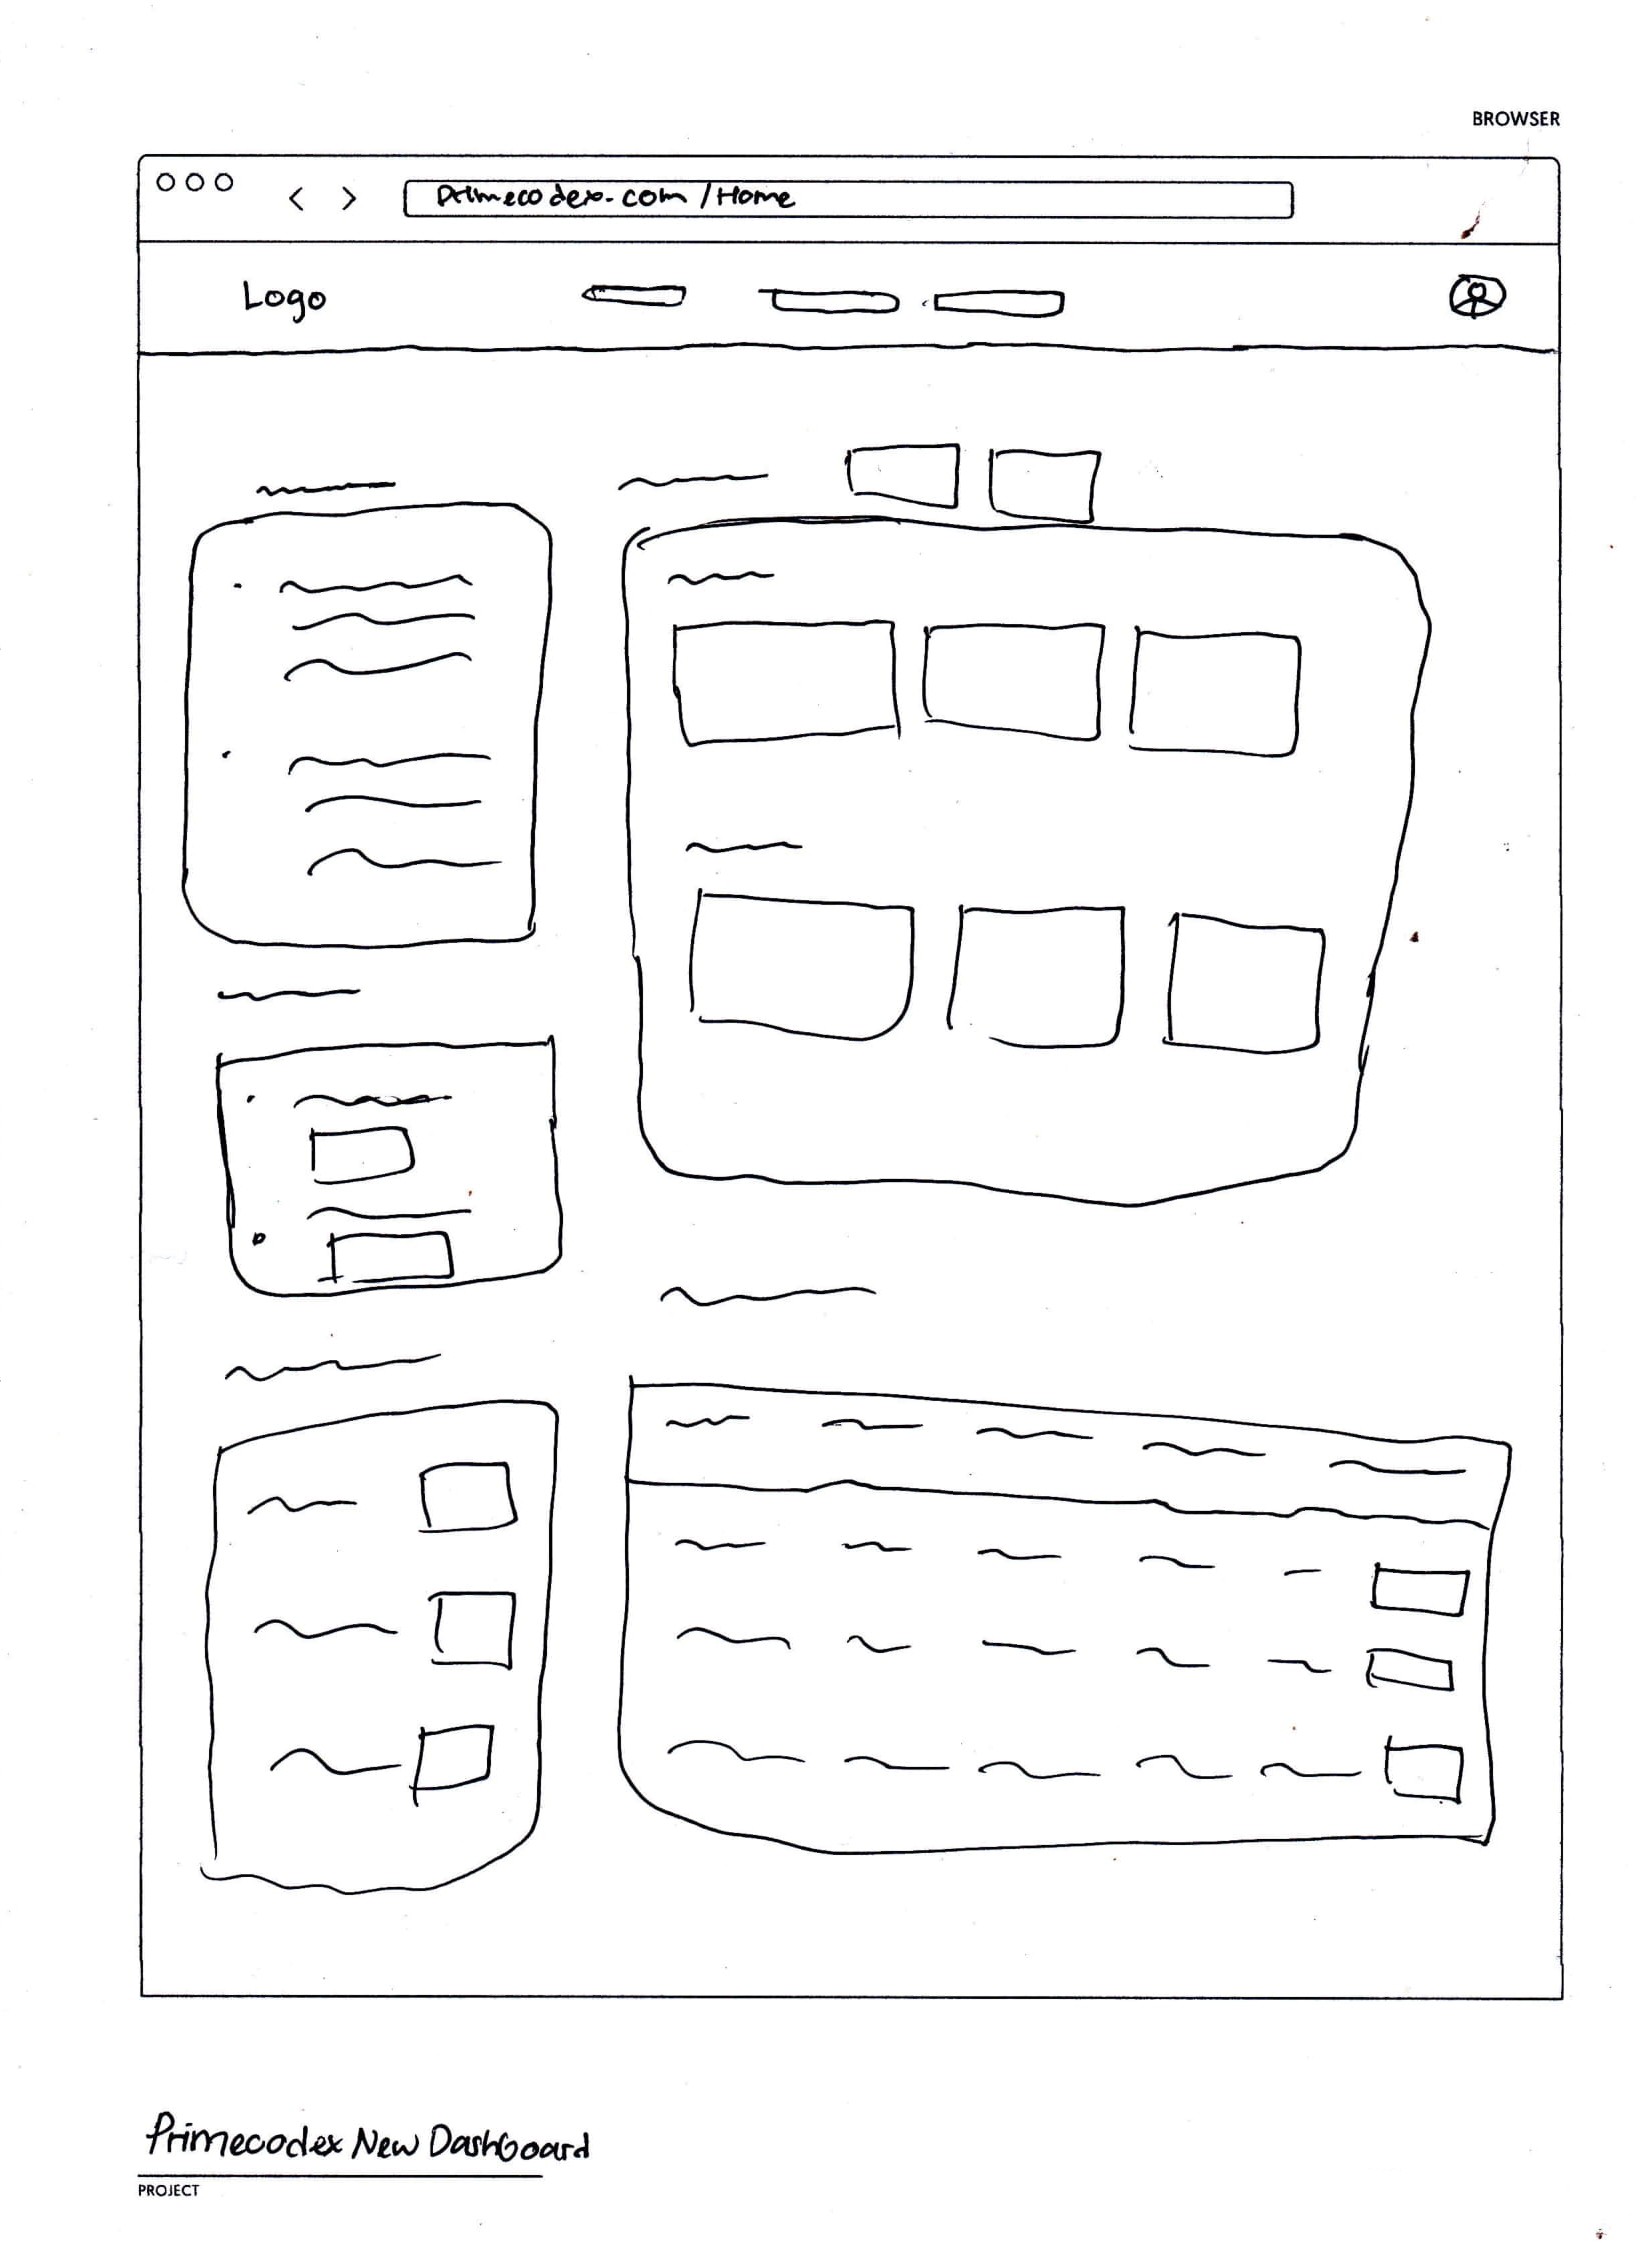
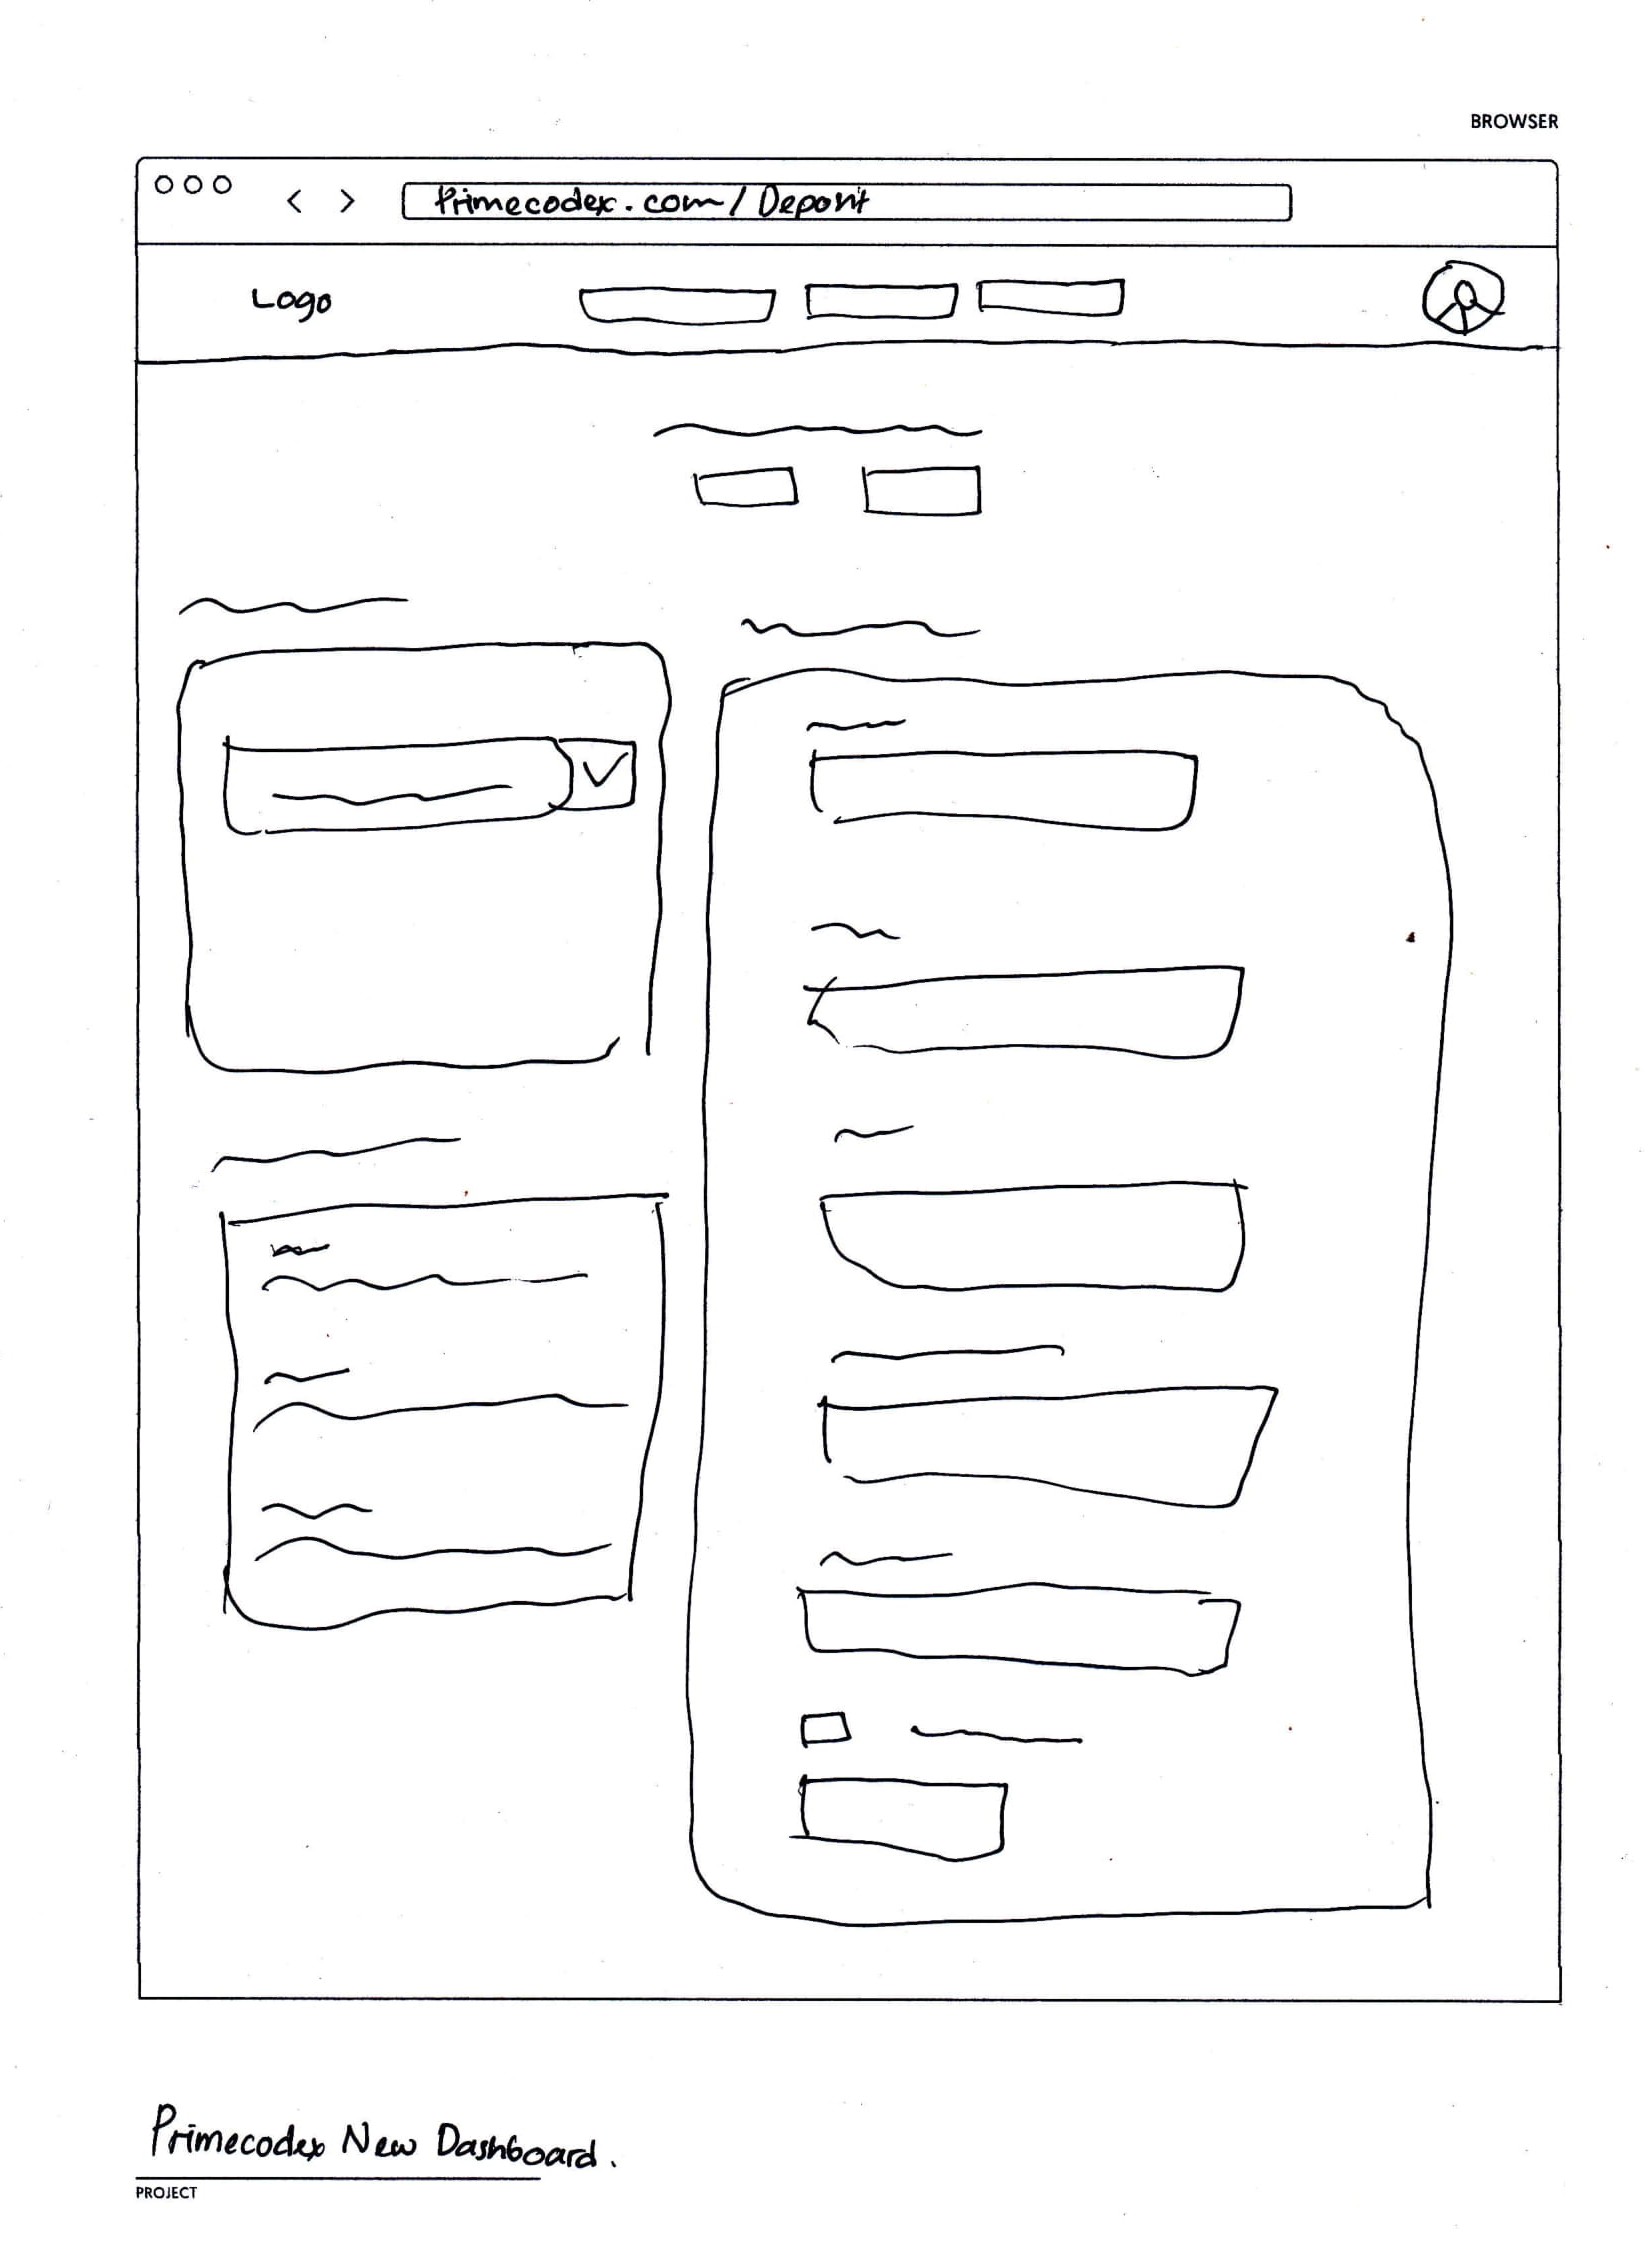
Visualizing Idea and Concept
Visualizing Idea and Concept
Visualizing Idea and Concept
I visualize the idea and concept that I had in mind by sketching. Doing this also helped me to understand the current feature that should also be implemented in the new dashboard without changing the user familiarity, and identify the screen ideas for the new feature.
I visualize the idea and concept that I had in mind by sketching. Doing this also helped me to understand the current feature that should also be implemented in the new dashboard without changing the user familiarity, and identify the screen ideas for the new feature.
I visualize the idea and concept that I had in mind by sketching. Doing this also helped me to understand the current feature that should also be implemented in the new dashboard without changing the user familiarity, and identify the screen ideas for the new feature.
Validating Idea and Concept Through Prototyping
Validating Idea and Concept Through Prototyping
Validating Idea and Concept Through Prototyping
Before going to high-fidelity design, I convert the paper sketches to a wireframe prototype. Using this prototype, I was able to test it with the user to get some important feedback and make a few changes before going to the high-fidelity. After the testing, and with all the feedback I received, then I continued to the high-fidelity phase.
Before going to high-fidelity design, I convert the paper sketches to a wireframe prototype. Using this prototype, I was able to test it with the user to get some important feedback and make a few changes before going to the high-fidelity. After the testing, and with all the feedback I received, then I continued to the high-fidelity phase.
Before going to high-fidelity design, I convert the paper sketches to a wireframe prototype. Using this prototype, I was able to test it with the user to get some important feedback and make a few changes before going to the high-fidelity. After the testing, and with all the feedback I received, then I continued to the high-fidelity phase.
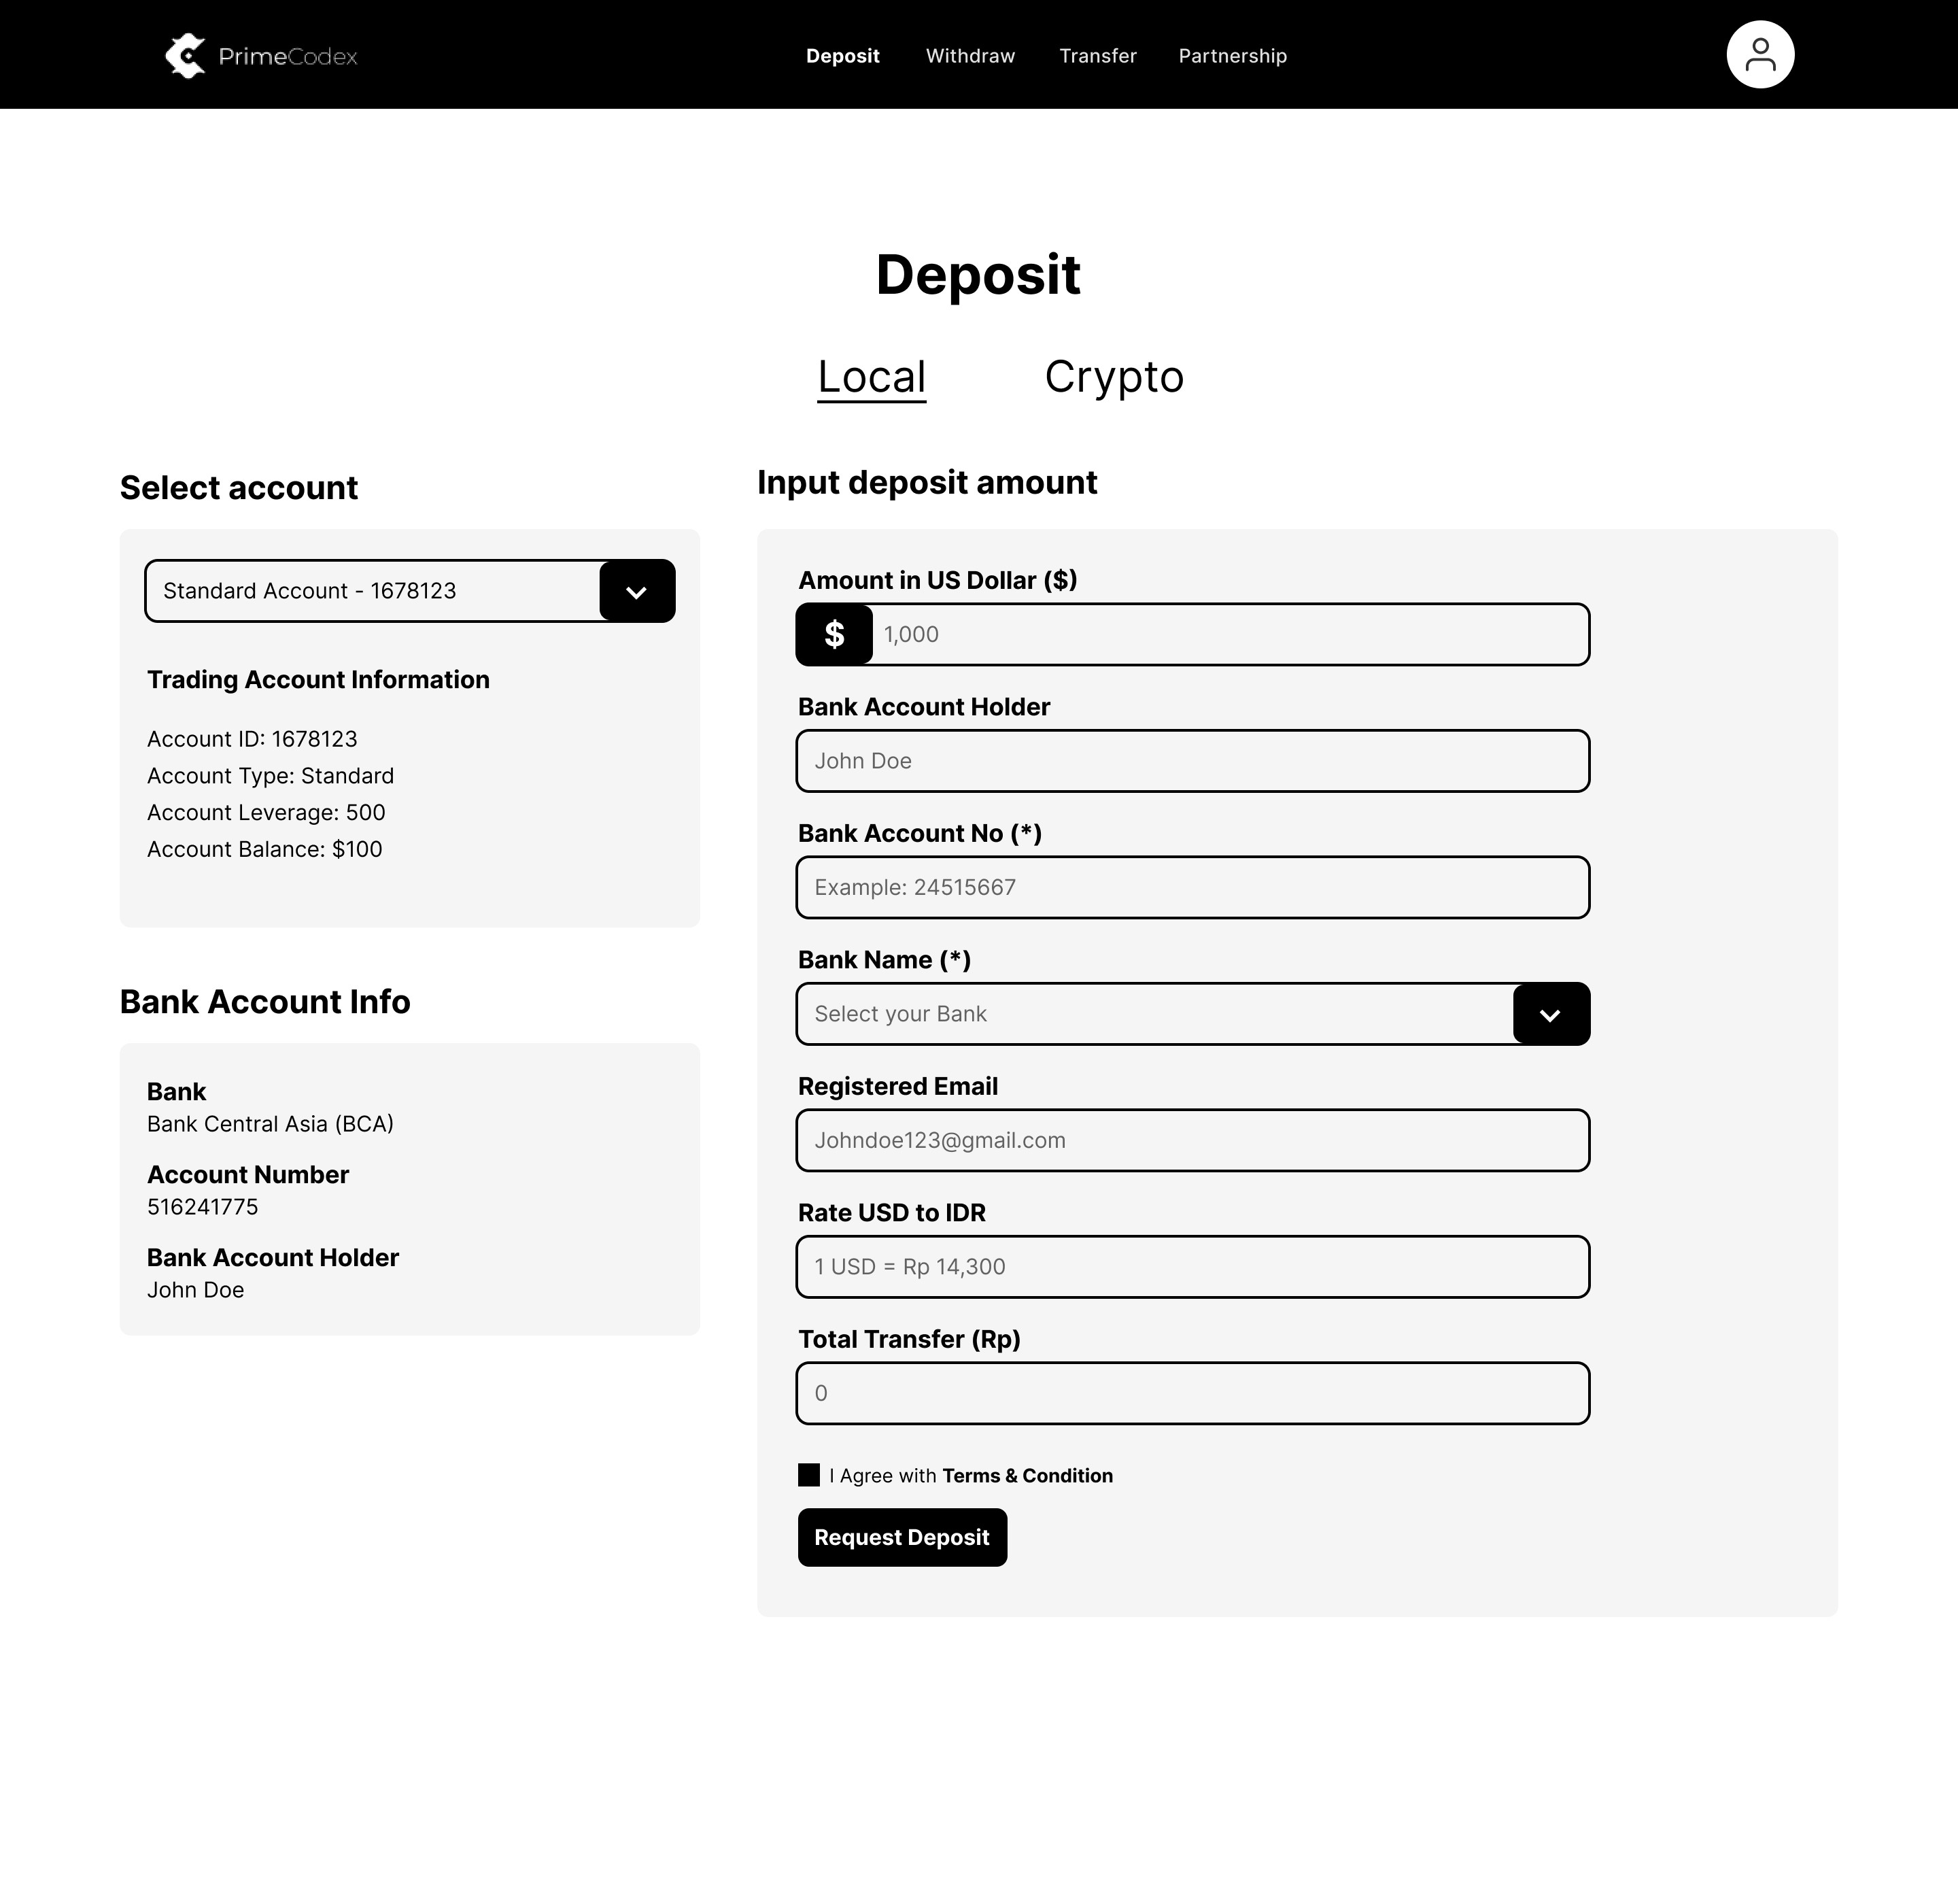
Finalizing the Solution
Finalizing the Solution
Finalizing the Solution
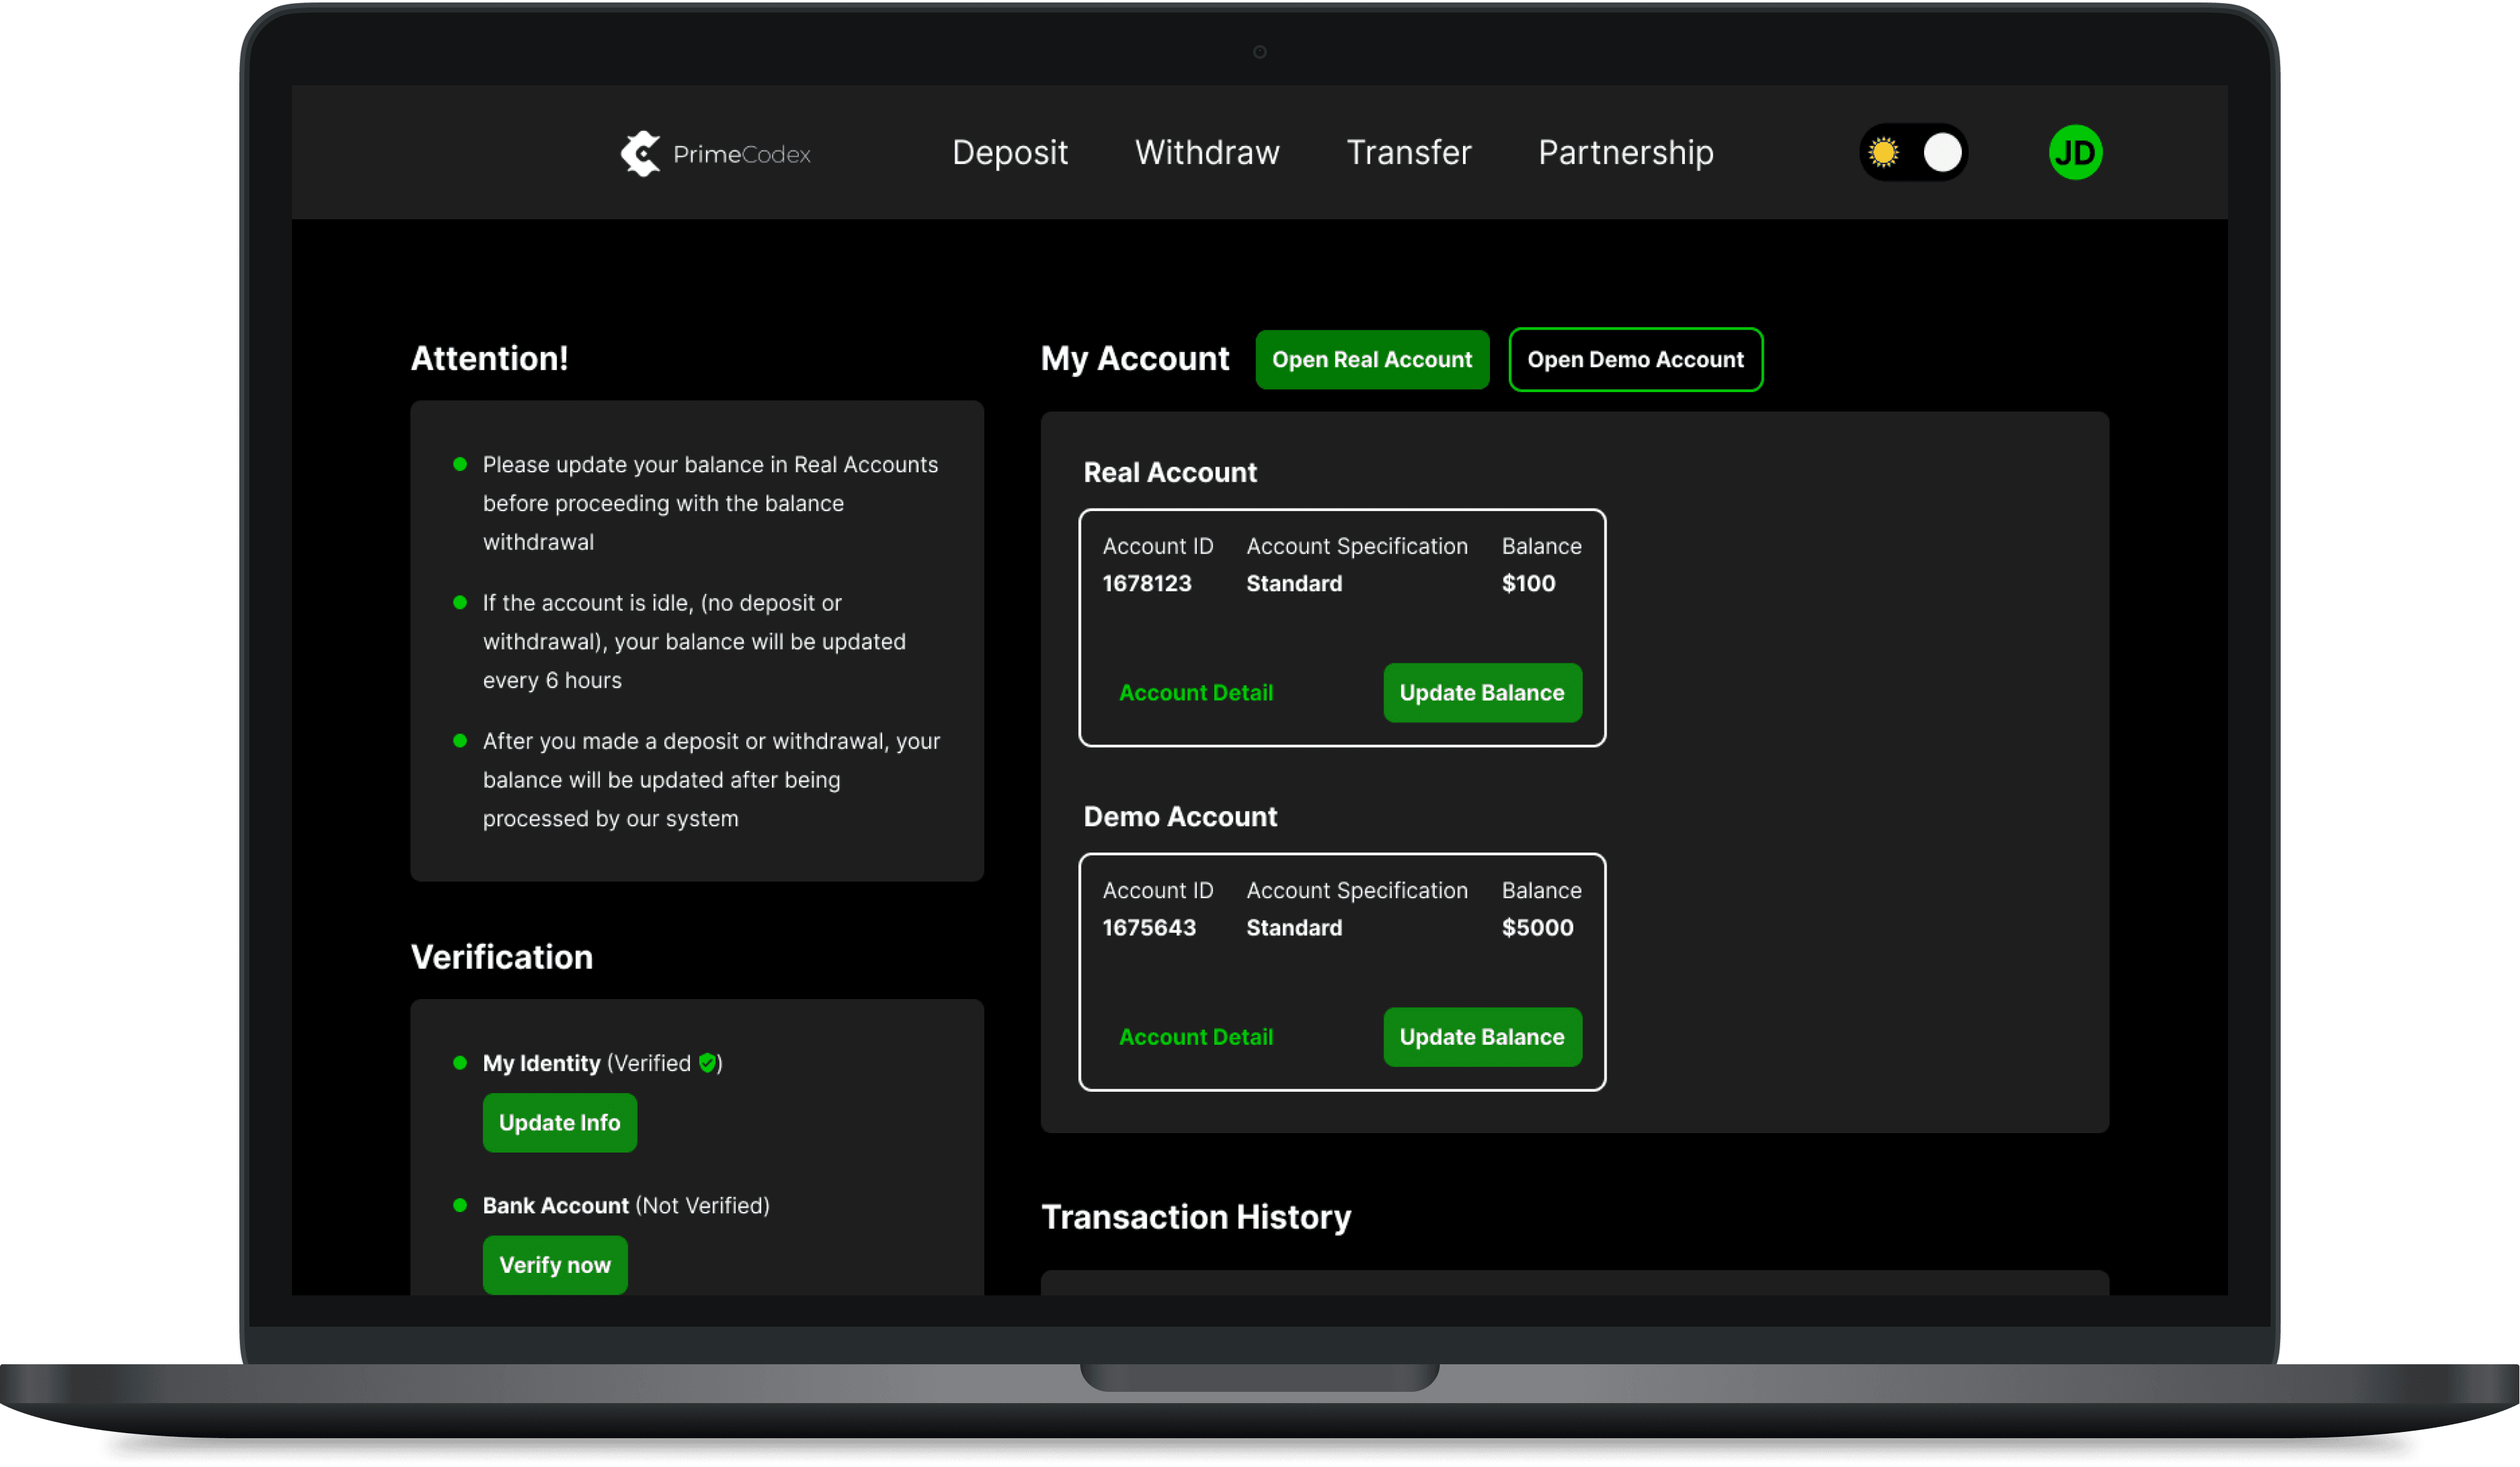
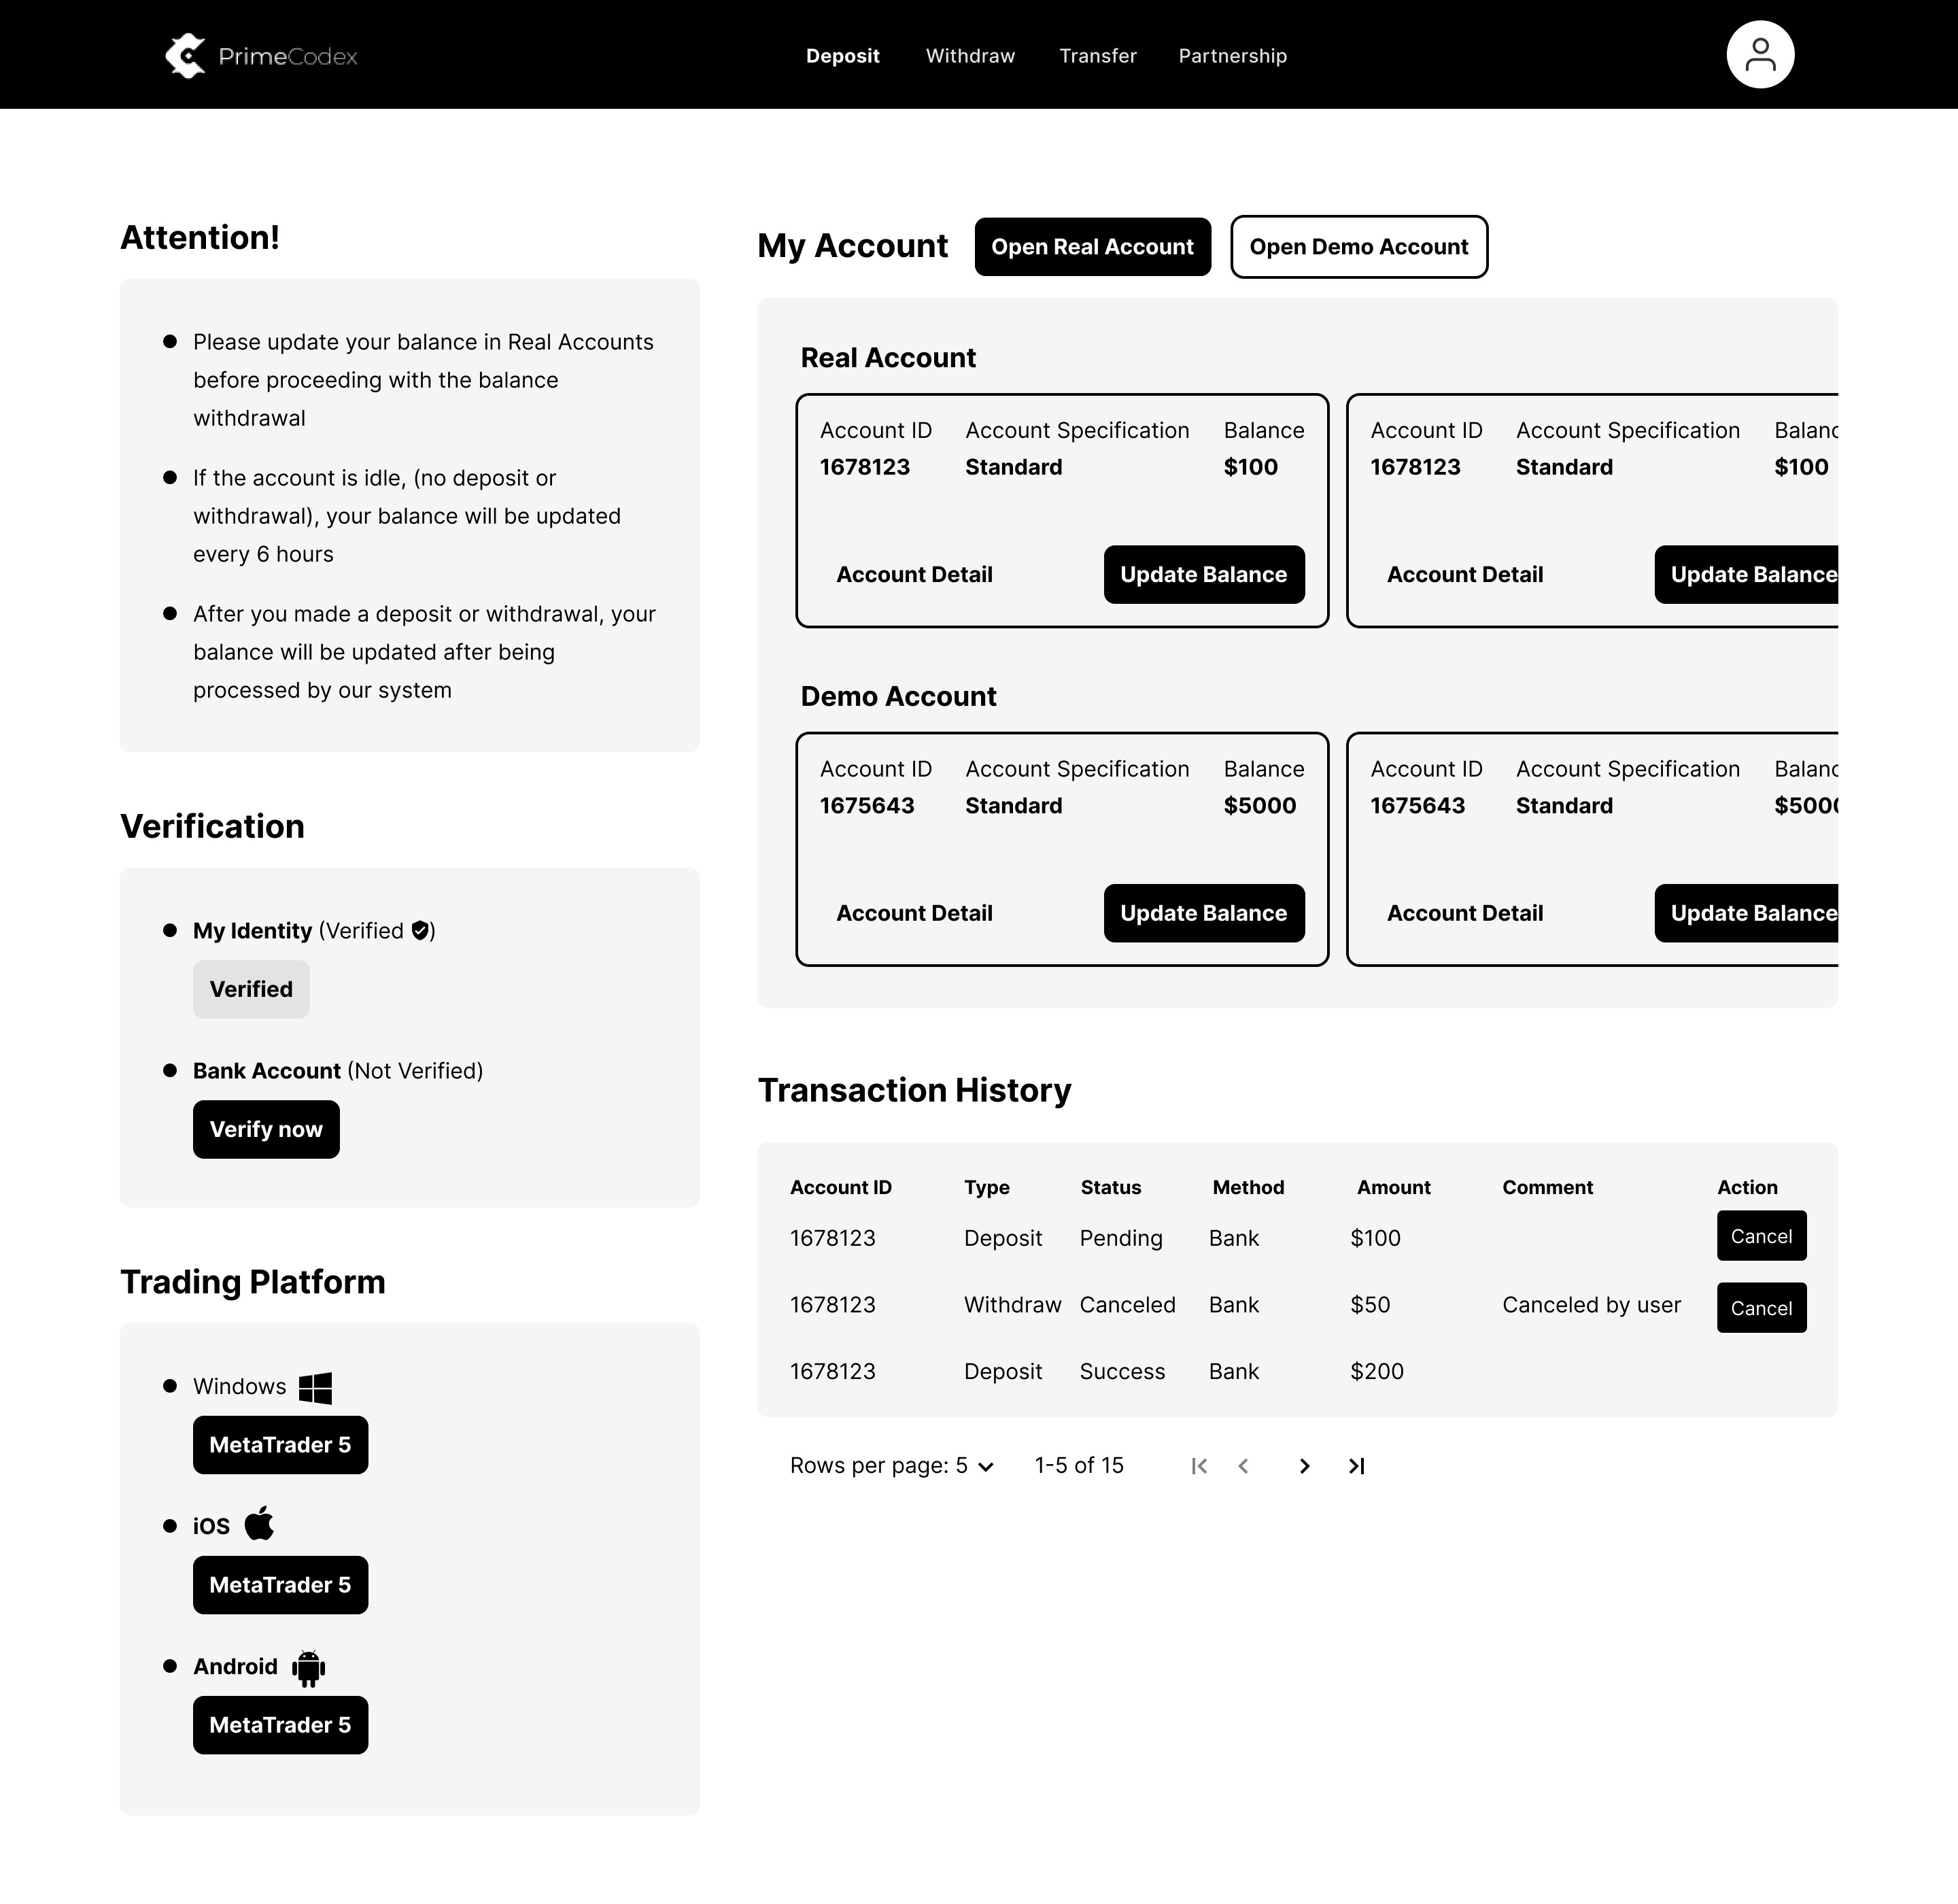
Final Design with Some Improvements + Dark Mode
Final Design with Some Improvements + Dark Mode
Final Design with Some Improvements + Dark Mode
After the High-fidelity design & prototype was completed, I did another round of testing with the users. This time, we only got minor feedback for example changing a few copies and increasing the font size. However, after discussing with the PM, we decided to add a Dark Mode because, on Dark Mode, the new dashboard really helps to represent the PrimeCodex brand colors. Also, some of the traders (users) are most active on nights so they think adding a Dark Mode would really help them. By default, we set the Dashboard to Light Mode, and users can switch to Dark Mode using the switch on the top right.
After the High-fidelity design & prototype was completed, I did another round of testing with the users. This time, we only got minor feedback for example changing a few copies and increasing the font size. However, after discussing with the PM, we decided to add a Dark Mode because, on Dark Mode, the new dashboard really helps to represent the PrimeCodex brand colors. Also, some of the traders (users) are most active on nights so they think adding a Dark Mode would really help them. By default, we set the Dashboard to Light Mode, and users can switch to Dark Mode using the switch on the top right.
After the High-fidelity design & prototype was completed, I did another round of testing with the users. This time, we only got minor feedback for example changing a few copies and increasing the font size. However, after discussing with the PM, we decided to add a Dark Mode because, on Dark Mode, the new dashboard really helps to represent the PrimeCodex brand colors. Also, some of the traders (users) are most active on nights so they think adding a Dark Mode would really help them. By default, we set the Dashboard to Light Mode, and users can switch to Dark Mode using the switch on the top right.
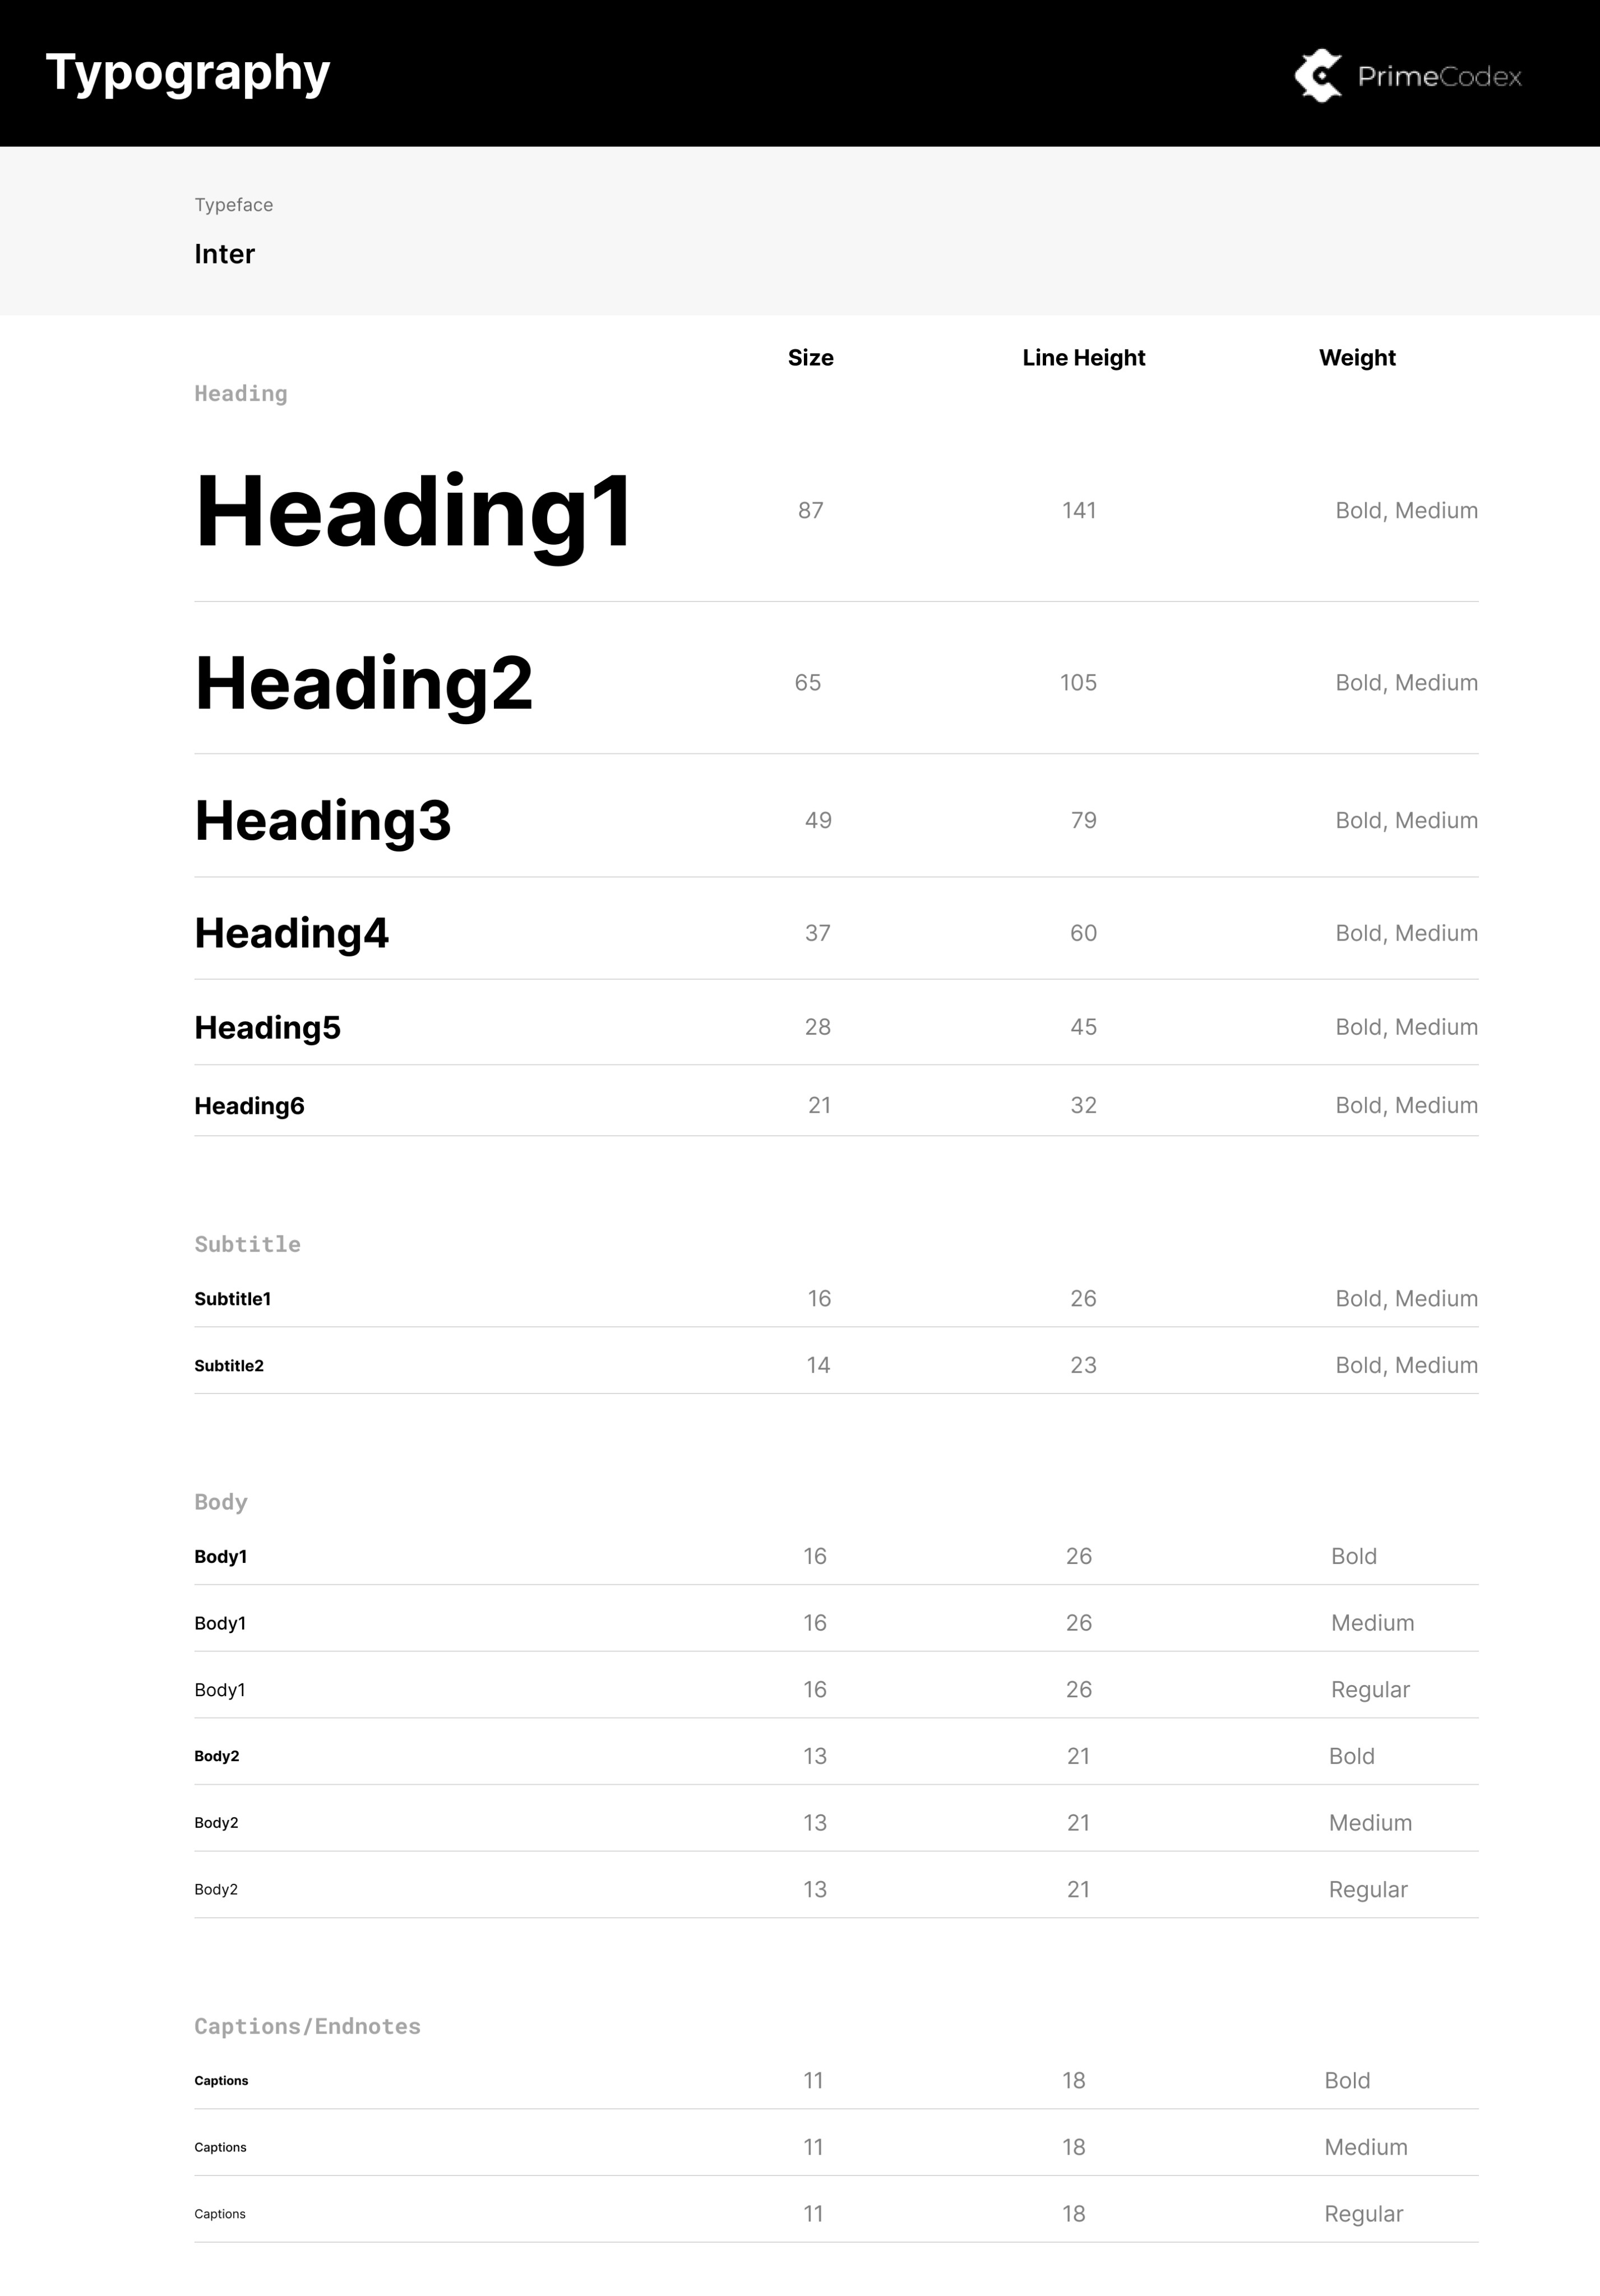
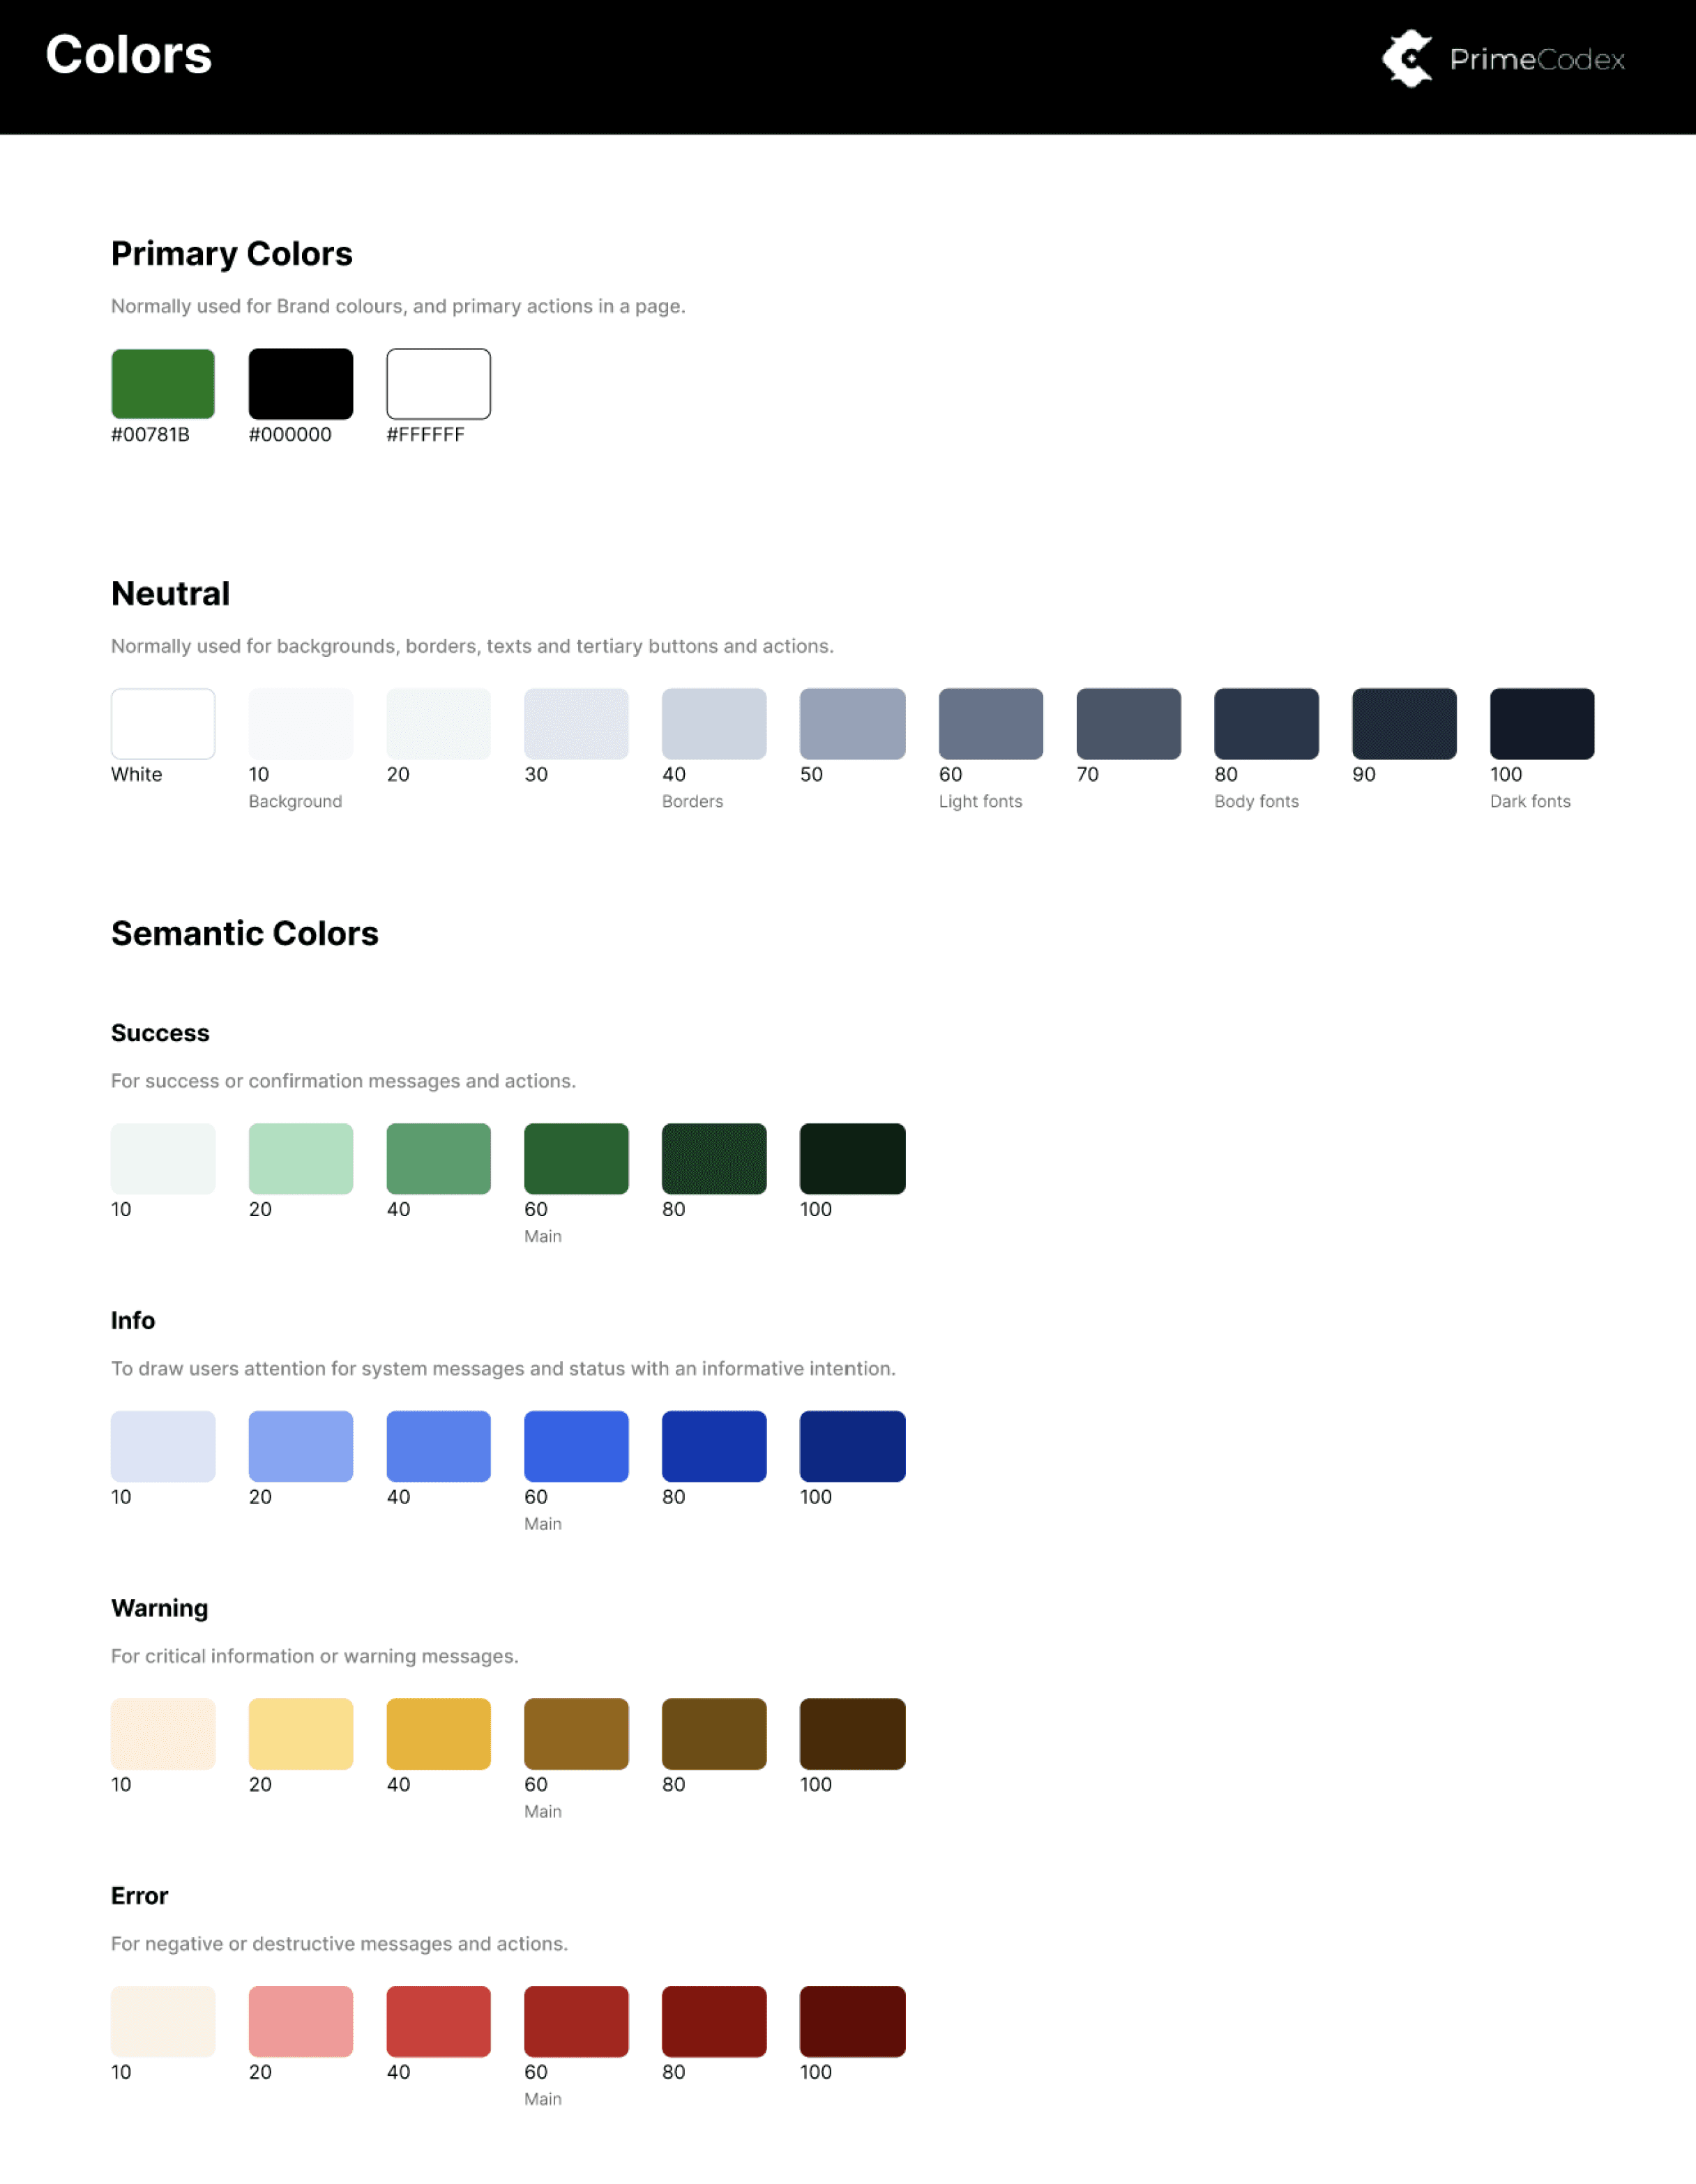
Establishing Visual Guideline
Establishing Visual Guideline
Establishing Visual Guideline
With the high-fidelity design and the prototype done, now it's time to make the new dashboard go live. I collaborated with the developer to discuss the flow for each screen, how will the dashboard react to certain actions from the users, and lastly I documented the visual aspect of the dashboard on the UI Kit. The UI Kit contains visual guidelines like the colors used in the design, typography, icon, button, spacing & grid, and etc.
With the high-fidelity design and the prototype done, now it's time to make the new dashboard go live. I collaborated with the developer to discuss the flow for each screen, how will the dashboard react to certain actions from the users, and lastly I documented the visual aspect of the dashboard on the UI Kit. The UI Kit contains visual guidelines like the colors used in the design, typography, icon, button, spacing & grid, and etc.
With the high-fidelity design and the prototype done, now it's time to make the new dashboard go live. I collaborated with the developer to discuss the flow for each screen, how will the dashboard react to certain actions from the users, and lastly I documented the visual aspect of the dashboard on the UI Kit. The UI Kit contains visual guidelines like the colors used in the design, typography, icon, button, spacing & grid, and etc.
Results & Future Improvements
Results & Future Improvements
Results & Future Improvements
2 months after the launched we spent our time analyzing the results and any possibility for future improvements.
2 months after the launched we spent our time analyzing the results and any possibility for future improvements.
2 months after the launched we spent our time analyzing the results and any possibility for future improvements.
Results
Results
Results
In the first two months, we noticed an increase of more than 10K active traders in the new dashboard.
In the first two months, we noticed an increase of more than 10K active traders in the new dashboard.
In the first two months, we noticed an increase of more than 10K active traders in the new dashboard.
We also noticed an increase in average transactions of more than $50K monthly.
We also noticed an increase in average transactions of more than $50K monthly.
We also noticed an increase in average transactions of more than $50K monthly.
Future Improvements
Future Improvements
Future Improvements
We also do another round of testing to collect any feedback for future improvements, the inputs are:
Adding a tooltip to help describe certain features.
Adding a demo or video to help users get started. This will help new users easily navigate the new dashboard.
More system status to help users get informed and aware of their actions.
Adding a data visualization to help users make decisions. For example, return calculation or trading calculation.
Detailed reports based on user activity/trading history. Personalized reports at a certain time.